Interactive Companion
6 Guided Deep-Dive Sections
Motor Imagery BCI
Motor imagery (MI)-based brain-computer interfaces (MI-BCIs) allow users to control external devices by imagining movements such as left- and right-hand movements.
During MI, characteristic modulations occur in , particularly in the mu and beta frequency bands. These neural patterns can be decoded to provide BCI control or neurofeedback.
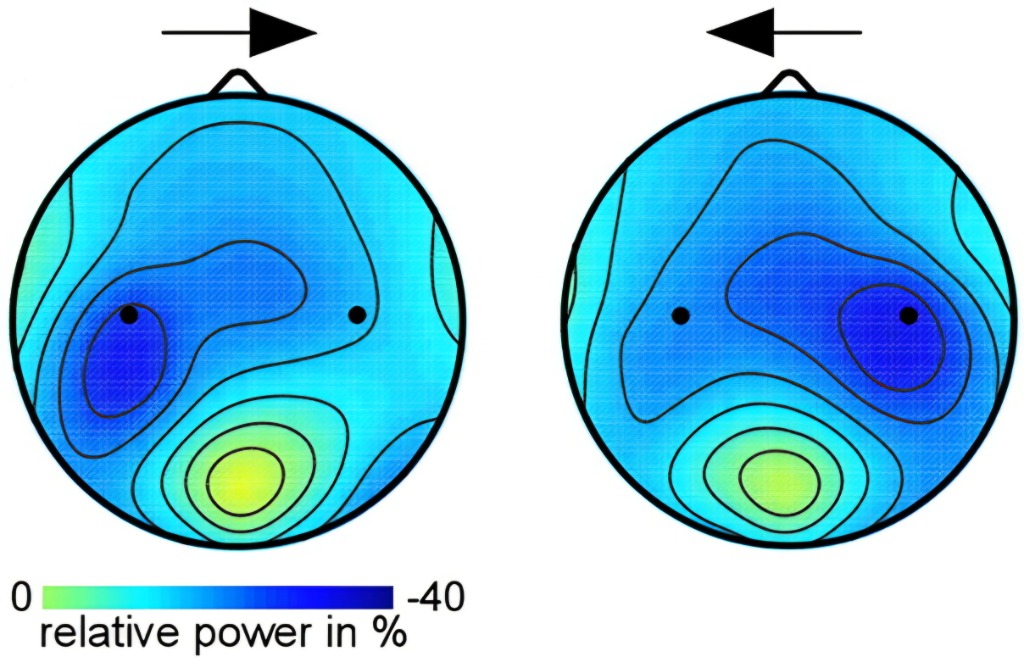
Sensorimotor Rhythm (SMR) Desynchronization: Topographical distribution showing localized contralateral ERD over motor cortex during imagery. Adapted from Zich et al. (2015). [Click to expand ↗]
Why Do Users Differ?
Despite advances in signal processing and machine learning, MI-BCI performance remains highly variable across individuals.
Approximately 10–30% of users fail to achieve reliable control, a phenomenon commonly referred to as .
MI-BCI control is increasingly viewed as a learnable cognitive-motor skill, requiring users to generate neural patterns that are:
- Stable within a class
- Discriminable between classes
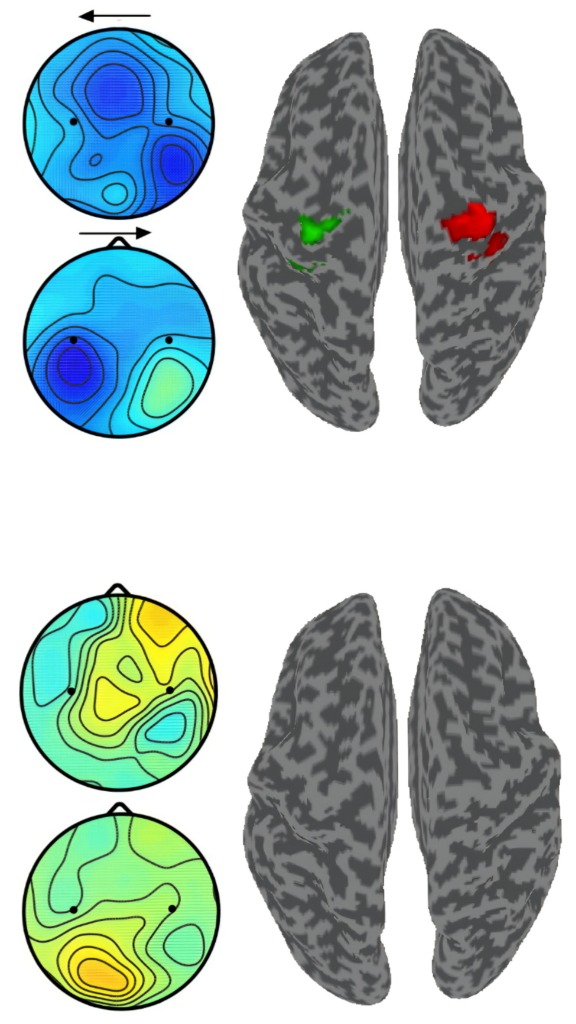
Literate vs. Illiterate User Profiles: Comparison of a literate user (top) showing distinct contralateral SMR ERD and localized motor cortex fMRI activation versus an illiterate user (bottom) showing absent ERD and lack of focal motor engagement. Adapted from Zich et al. (2015). [Click to expand ↗]
The Laterality Perspective
Traditional MI-BCI evaluation relies primarily on classifier accuracy, with successful decoding commonly interpreted in terms of left–right neural separability and .
However, classifier accuracy primarily reflects the separability of task-related neural representations. Effective BCI control may also depend on how consistently these representations are generated and how distinctly they differ from baseline activity.
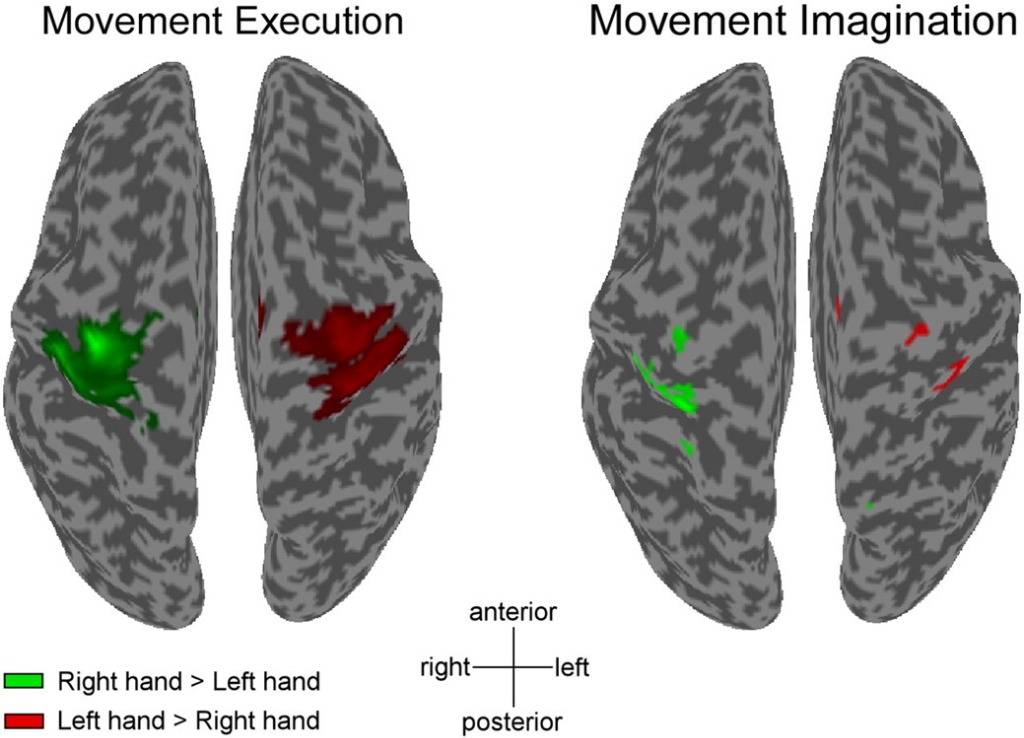
Hemispheric Laterality: Cortical surface activation maps showing contralateral sensorimotor engagement during motor execution and motor imagery. Adapted from Zich et al. (2015). [Click to expand ↗]
A Multidimensional View
operate directly on the covariance structure of multichannel EEG and quantify complementary dimensions of neural organization:
| Metric | What It Captures |
|---|---|
| Class distinctiveness | Left ↔ Right imagery separation |
| Class stability | Within-class consistency |
| Rest distinctiveness | MI ↔ Baseline separation |
This motivates examining MI-BCI learning beyond hemispheric laterality alone.
Primary Aim
To investigate how Riemannian geometry-based neural metrics relate to users' reported MI-BCI performance across training.
What We Investigated
- Neural–behavioral relationship: Examine associations between class distinctiveness, class stability, rest distinctiveness and reported MI-BCI performance.
- Longitudinal adaptation: Track how these neural metrics change across 5 training runs.
- Learning trajectories: Compare neural adaptation across Improved, Unchanged, and Worsened behavioral groups.
Emerging Question
“Do changes in MI-BCI performance reflect hemispheric laterality alone, or do multiple dimensions of neural organization contribute to learning?”
Hypothesis
Successful MI-BCI learning is associated with coordinated changes in class distinctiveness, class stability, and rest distinctiveness.
We analyzed 64-channel EEG from 44 participants (Cho et al., 2017) performing left- and right-hand motor imagery across five training runs. Neural representations were quantified using three Riemannian geometry-based metrics across six frequency bands and related to longitudinal behavioral performance.
Stage 1
Dataset & Behavioral Stratification
We utilized the benchmark 64-channel EEG dataset from Cho et al. (2017) [4], recording healthy participants performing cue-based left- and right-hand motor imagery across five training runs.
Dataset Source
Cho et al. (2017) [4] (Public MI Dataset)
Cohort Size
52 recruited → 44 analyzed (19 female, age 24.8 ± 3.86)
EEG System & Rate
64-channel BioSemi ActiveTwo @ 512 Hz
Task Paradigm
Left- vs. Right-hand Motor Imagery (MI)
Protocol Volume
5 runs × 20 trials/class (200 trials/participant)
Post-Run Reports
Expected Performance (%) & Imagery Difficulty
Behavioral Learning Trajectory
Expected MI-BCI performance was used to characterize longitudinal learning. For each participant, an Ordinary Least Squares (OLS) regression was fitted:
$$\text{Expected Performance} \sim \text{Run} \quad \longrightarrow \quad \text{Slope (\% change / run)}$$
Improved ($n = 15$): Positive Slope
Unchanged ($n = 16$): Intermediate Slope
Worsened ($n = 13$): Negative Slope
Stage 2
EEG Preprocessing & Epoching
Raw signals were preprocessed in MNE-Python using a standardized 10-step cleaning pipeline:
- DC Offset Correction & Linear Detrending
- 0.1–50 Hz Band-Pass Filtering & 60 Hz Notch Filtering
- RANSAC Noisy-Channel Repair
- Artifact Subspace Reconstruction (ASR) for transient artifact removal
- Infomax Independent Component Analysis (ICA)
- mne-icalabel Automated Identification (components with >90% artifact probability removed)
- Noisy-Channel Spherical Spline Interpolation
- Common Average Reference (CAR) Re-referencing
Epoching Windows
- Full Epoch: −1.99 s to +5.0 s relative to cue onset
- Motor Imagery Window: 0.0 s to 3.0 s (active task)
- Resting Reference: −1.99 s to 0.0 s (trial-wise pre-cue baseline)
6 Spectral Bands
| Band | Frequency Range |
|---|---|
| Delta | 1–4 Hz |
| Theta | 4–8 Hz |
| Alpha | 8–13 Hz |
| Beta | 13–30 Hz |
| Gamma | 30–45 Hz |
| Broadband | 0.1–50 Hz |
Stage 3
Riemannian Neural Metrics
Each MI trial was represented by its multichannel covariance structure. These covariance matrices were analyzed using Riemannian geometry on the manifold $\mathcal{S}_{++}^n$ and the three classifier-independent metrics proposed by Lotte & Jeunet [9].
Left MI ↔ Right MI
Class Distinctiveness
Measures separation between the two imagery classes on the manifold.
$$\text{classDis}(A,B) = \frac{\delta_R(\bar{C}_A, \bar{C}_B)}{\frac{1}{2}(\sigma_{C_A} + \sigma_{C_B})}$$
Within-Class Consistency
Class Stability
Measures the consistency of spatial covariance patterns within a class.
$$\text{classStab}(A) = \frac{1}{1 + \sigma_{C_A}}$$
MI ↔ Baseline
Rest Distinctiveness
Measures separation between task-related imagery and pre-cue resting baseline.
$$\text{restDis}(A) = \frac{\delta_R(\bar{C}_A, C_{\text{rest}})}{\frac{1}{2}(\sigma_{C_A} + \sigma_{\text{rest}})}$$
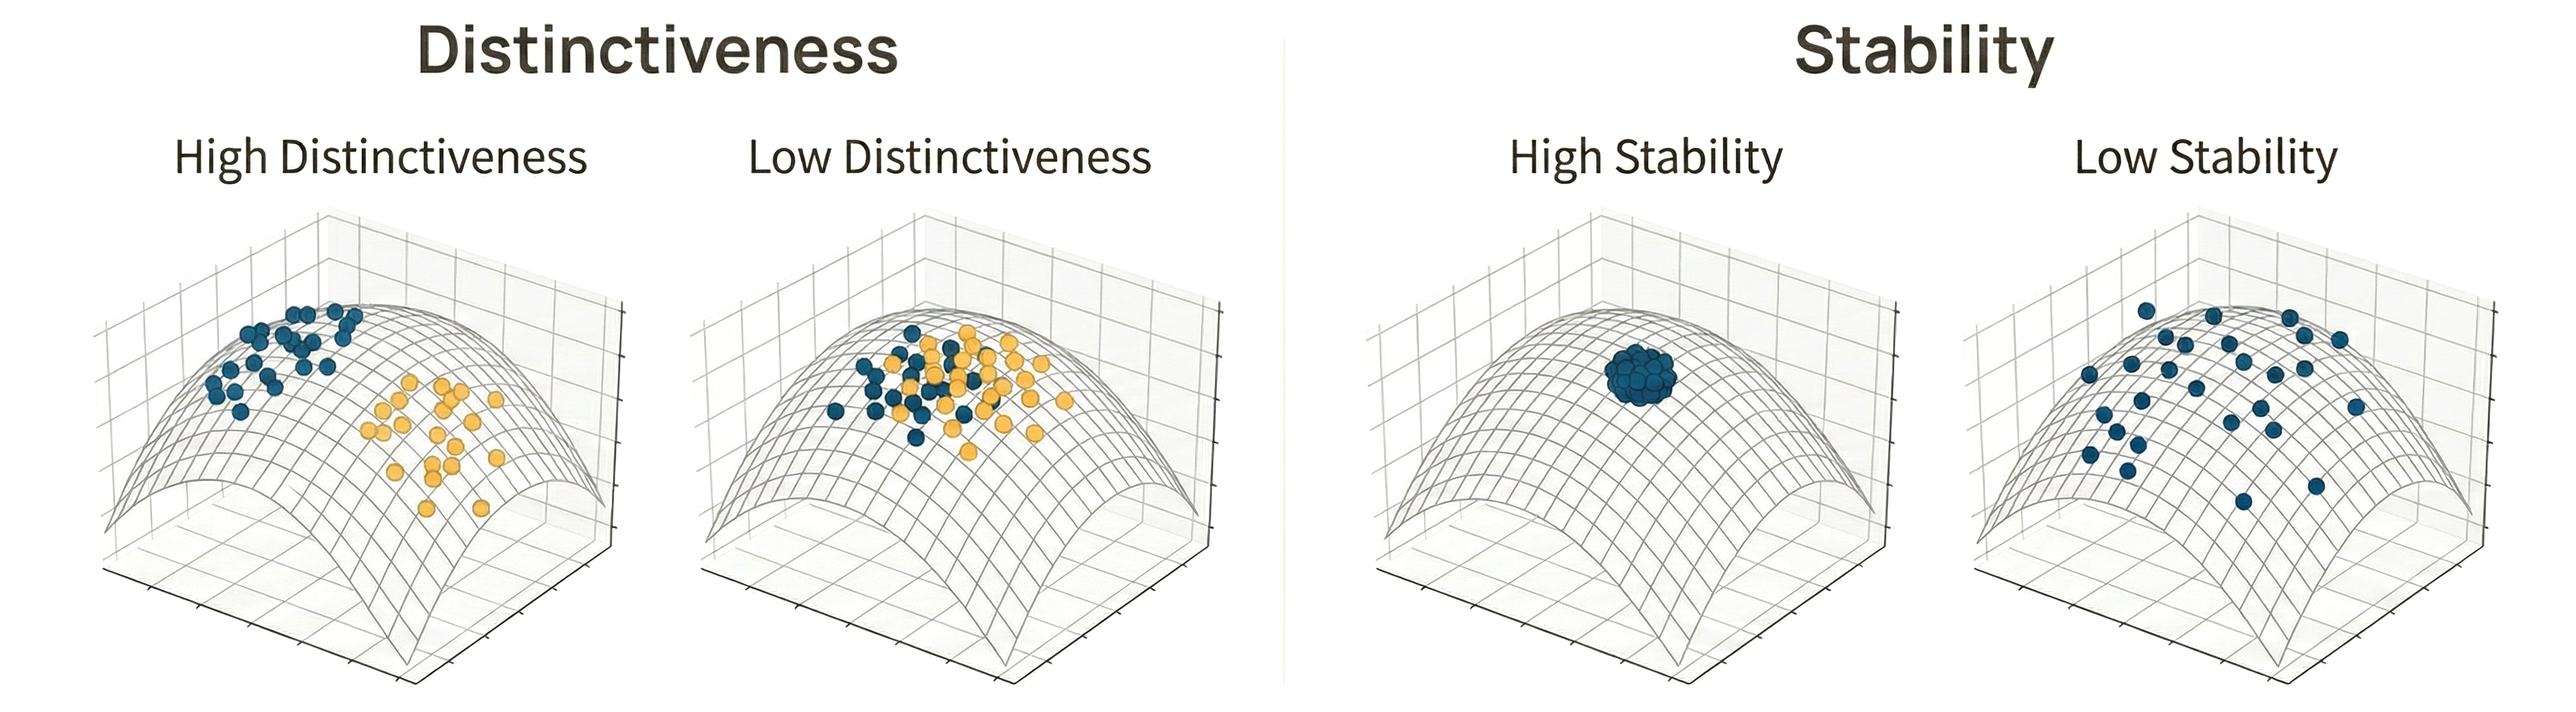
Geometric Representation on $\mathcal{S}_{++}^n$: Distinctiveness represents geodesic distances between class Fréchet centroids ($\bar{C}_A, \bar{C}_B$) or task and rest baseline ($C_{\text{rest}}$), while stability reflects the inverse of intra-class trial dispersion ($\sigma_{C_A}$).
Why Three Metrics?
Class distinctiveness captures separation between imagery classes, class stability captures within-class consistency, and rest distinctiveness captures separation from baseline activity.
Stage 4
Longitudinal Neural Adaptation
To track how neural representations evolve over training, run-wise adaptation trajectories were computed for each participant:
- Feature Matrix: 3 metrics × 6 frequency bands = 18 combinations. Including class-specific components (Left vs. Right) yielded 35 neural features per participant.
- Standardization: Population-level $z$-score normalization was applied to align metric scales across bands.
- Outlier Filtering: Extreme values exceeding $|Z| > 2$ were removed.
- Trajectory Slope Fitting: OLS regression was fitted across the five runs:
$$\text{Neural Metric} \sim \text{Run} \quad \longrightarrow \quad \text{Slope } \beta$$
Positive Slope (+)
Increasing neural modulation across runs.
Negative Slope (−)
Decreasing neural modulation across runs.
Stage 5
Statistical Evaluation & Benchmarking
A. Correlation
Spearman Rank Correlation
Examined associations between expected MI-BCI performance and neural metric values across frequency bands, before and after behavioral stratification.
B. Group Differences
Kruskal–Wallis Permutation
Compared neural adaptation slopes across Improved, Unchanged, and Worsened groups using 5,000 permutations ($p < 0.05$), with post-hoc Mann–Whitney U and Holm–Bonferroni correction.
C. Effect Sizes
One-vs-Rest Cohen's d
Compared the slope distribution of each behavioral group against the pooled remainder (Target vs. Rest) to identify signatures uniquely characteristic of each trajectory.
Participants were stratified based on behavioral performance trajectories across five training runs, followed by analyses of run-wise neural metric changes, frequency-specific relationships with performance, group-level slope differences, and discriminative neural signatures to examine how different dimensions of neural organization relate to MI-BCI learning.
1. Behavioral Stratification Across Training Runs
Participants exhibited heterogeneous behavioral trajectories across the five runs. Based on the slope of reported BCI performance across runs, participants were categorized into three groups:
- Improved ($n = 15$): Showed a progressive increase in reported performance from approximately $56\%$ in Run 1 to over $72\%$ by Run 5 (Fig. 1A).
- Unchanged ($n = 16$): Remained relatively stable around $60\text{--}62\%$ across runs.
- Worsened ($n = 13$): Declined from about $72\%$ in Run 1 to $61\%$ by Run 5.
Imagery Difficulty Pattern
Subjective imagery difficulty showed a different pattern from reported performance (Fig. 1B):
- The Improved group reported moderate difficulty with a temporary improvement around Run 3.
- The Worsened group reported relatively easy imagery throughout.
- The Unchanged group consistently reported greater difficulty.
Takeaway: Perceived imagery ease did not directly correspond to performance improvements. Reported BCI performance reflects subjective evaluation of MI-BCI control, whereas imagery difficulty reflects how difficult participants perceived the motor imagery task itself.
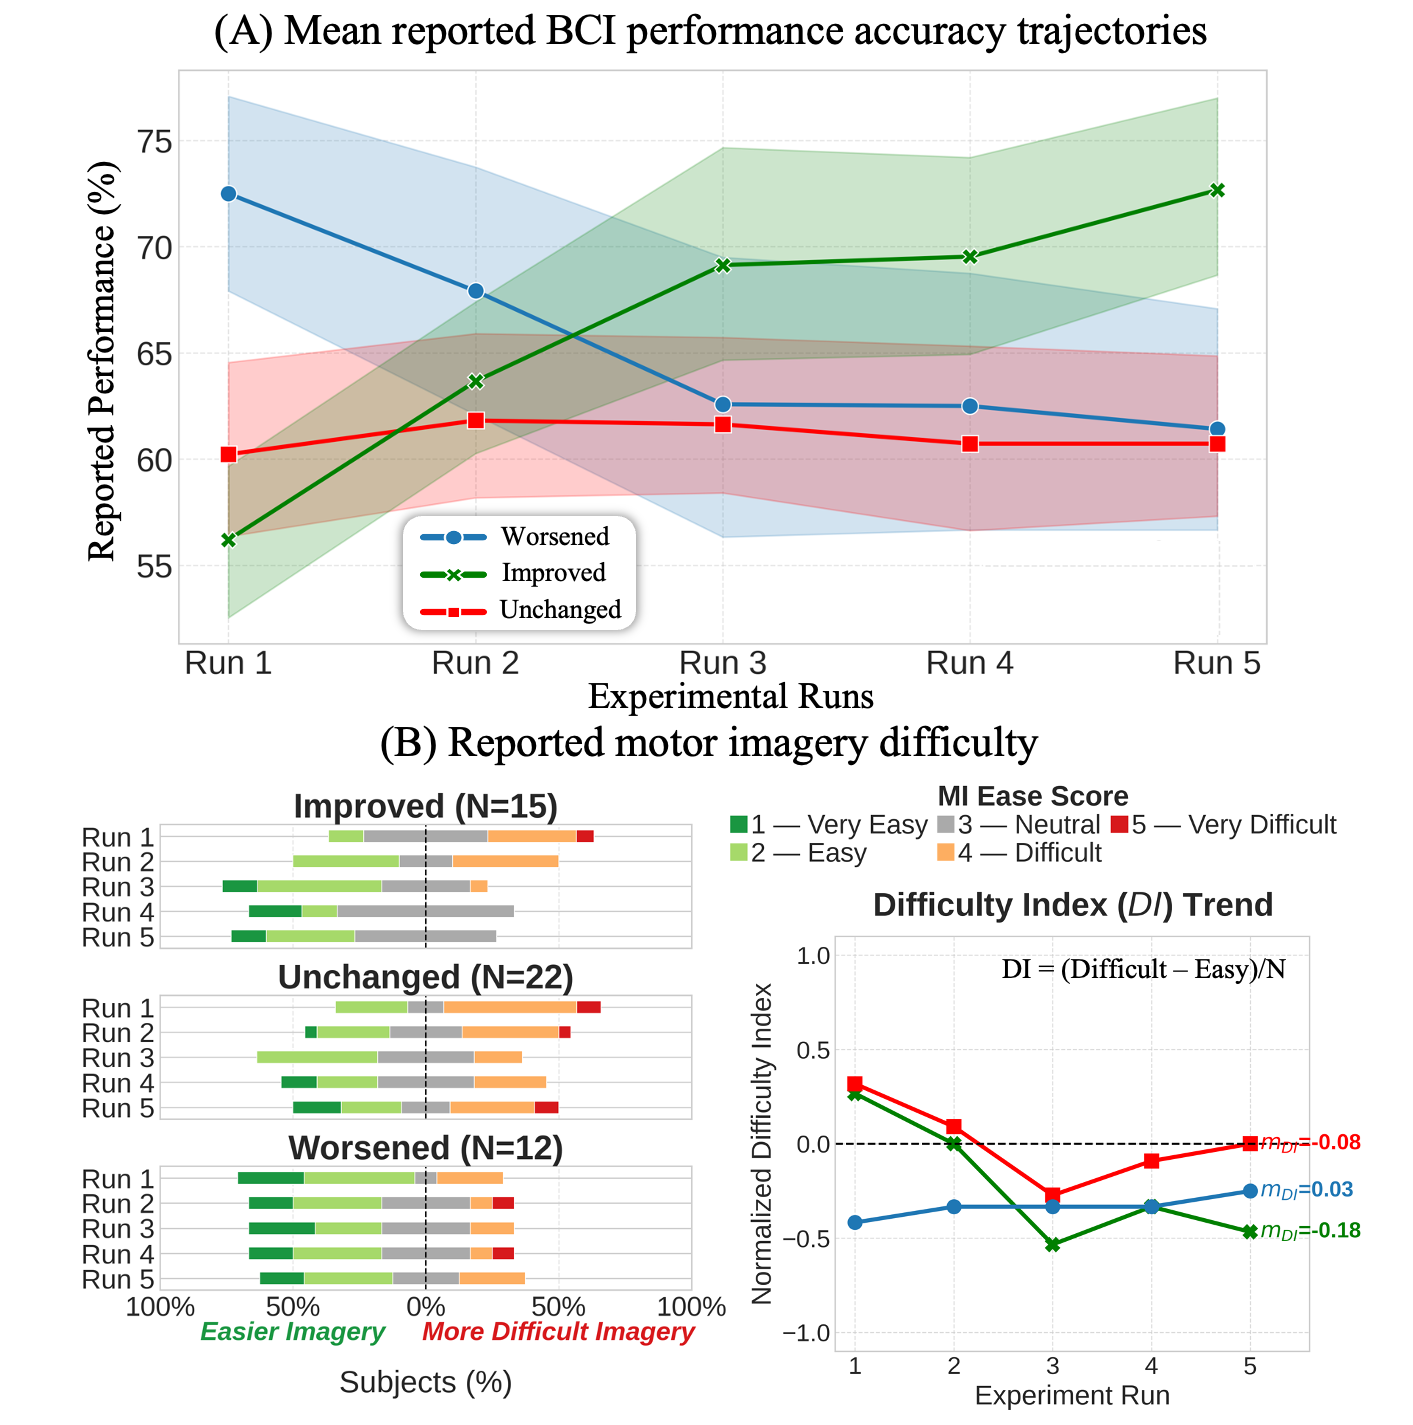
Figure 1: a) Average self-reported expected MI-BCI performance (%) across 5 runs, categorized by learning slope (Improved, Unchanged, Worsened). b) Distribution of reported motor imagery difficulty ratings across 5 runs. [Click to inspect ↗]
2. Run-Wise Neural Metric Changes
To examine neural adaptation across runs, broadband Riemannian neural metrics were computed relative to each participant's Run 1 baseline, using the pre-cue baseline as the resting reference (Fig. 2):
- Improved Group: Showed increasing trends across , , and metrics, indicating progressively more separable and consistent motor imagery representations.
- Unchanged Group: Showed mild declining trends across class stability and left–right distinctiveness metrics, indicating limited longitudinal improvement in neural representations.
- Worsened Group: Showed mild increases in left–right distinctiveness and stability metrics, but decreasing rest distinctiveness, indicating progressively structured representations with reduced separation from baseline neural activity.
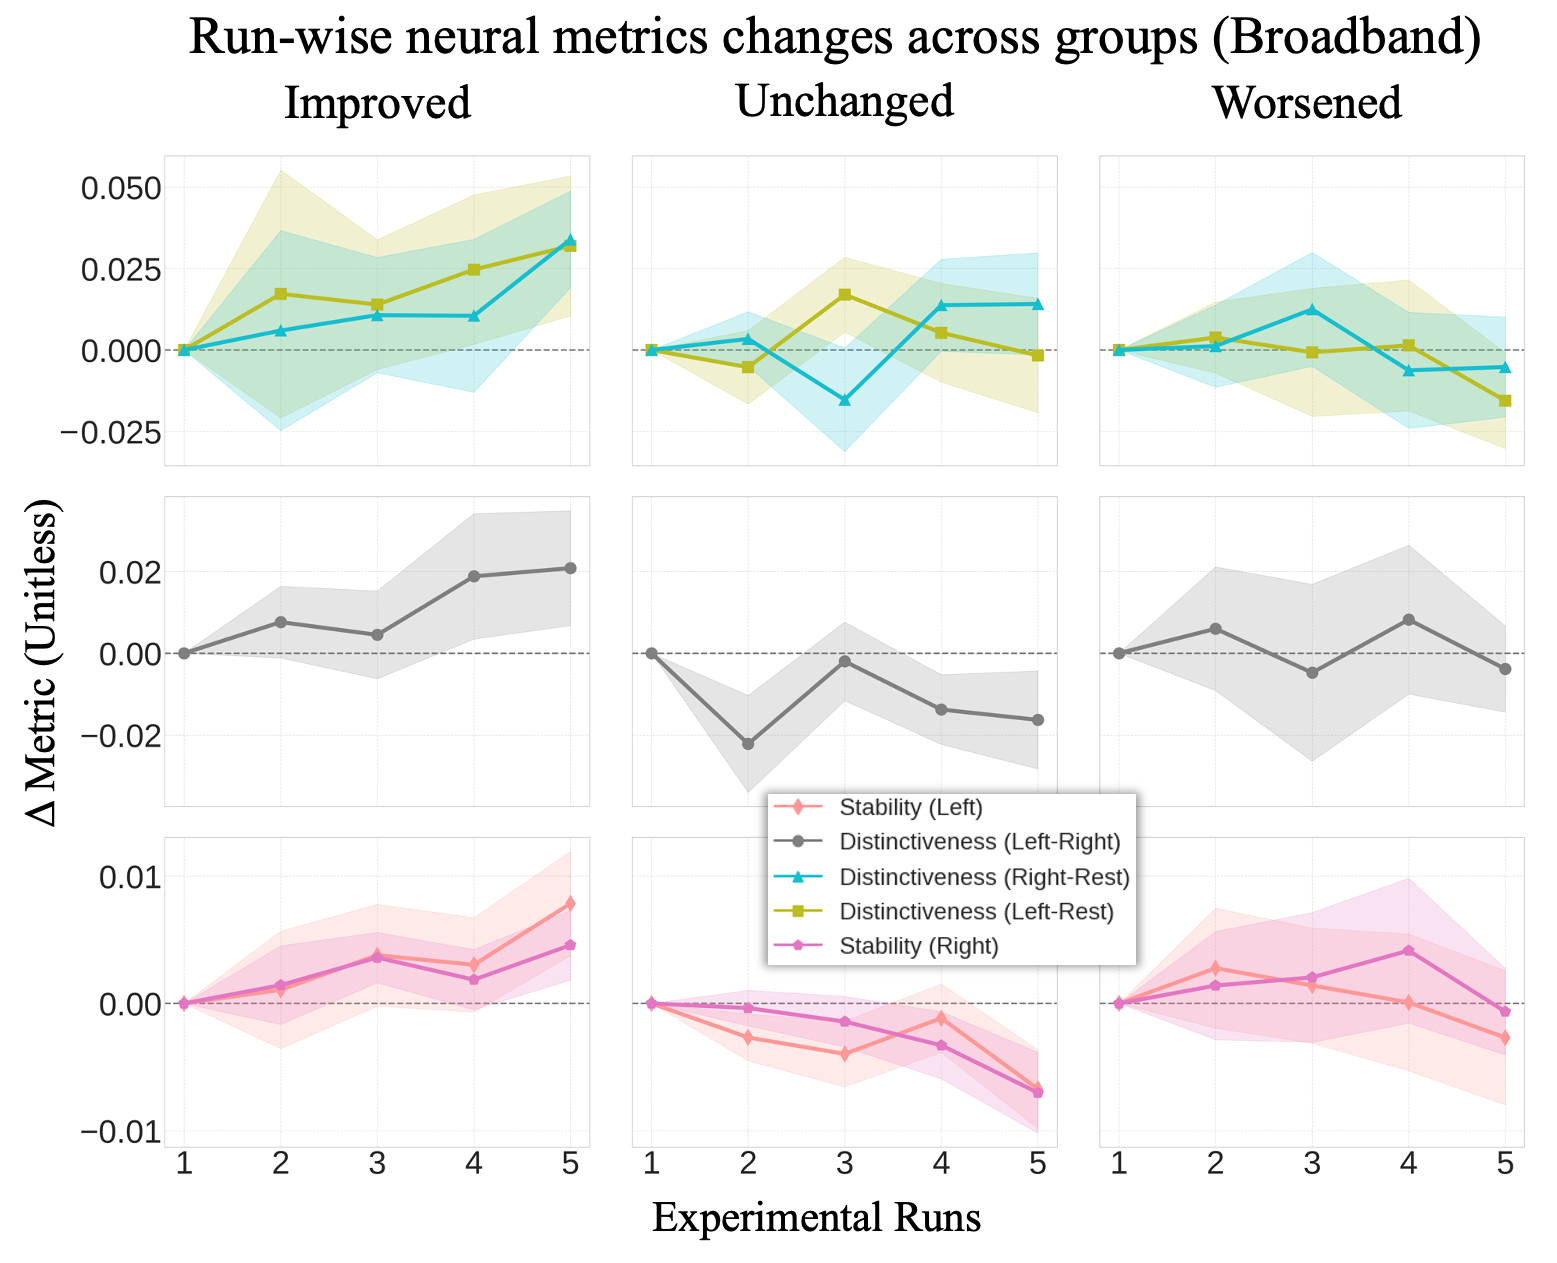
Figure 2: Run-wise changes in broadband neural metrics across behavioral groups relative to each subject's Run 1 baseline. Lines represent median changes across subjects, and shaded regions indicate SEM across subjects. [Click to inspect ↗]
3. Frequency-Specific Neural Correlates
Spearman correlations were computed between reported behavioral performance and neural metrics across frequency bands ($\delta, \theta, \alpha, \beta, \gamma$, and broadband) (Fig. 3):
- Before Stratification (All Subjects): Across runs, correlations strengthened particularly in the beta ($13\text{--}30\text{ Hz}$) and gamma ($30\text{--}45\text{ Hz}$) bands, especially for rest-related distinctiveness and left–right separability.
- After Stratification (Behavioral Groups):
- Improved Group: Showed stronger and more consistent correlations in lower frequency bands.
- Unchanged Group: Exhibited weaker and more heterogeneous relationships.
- Worsened Group: Correlations were primarily observed in higher frequency bands, suggesting that spectral features alone may not fully explain the decline in performance.
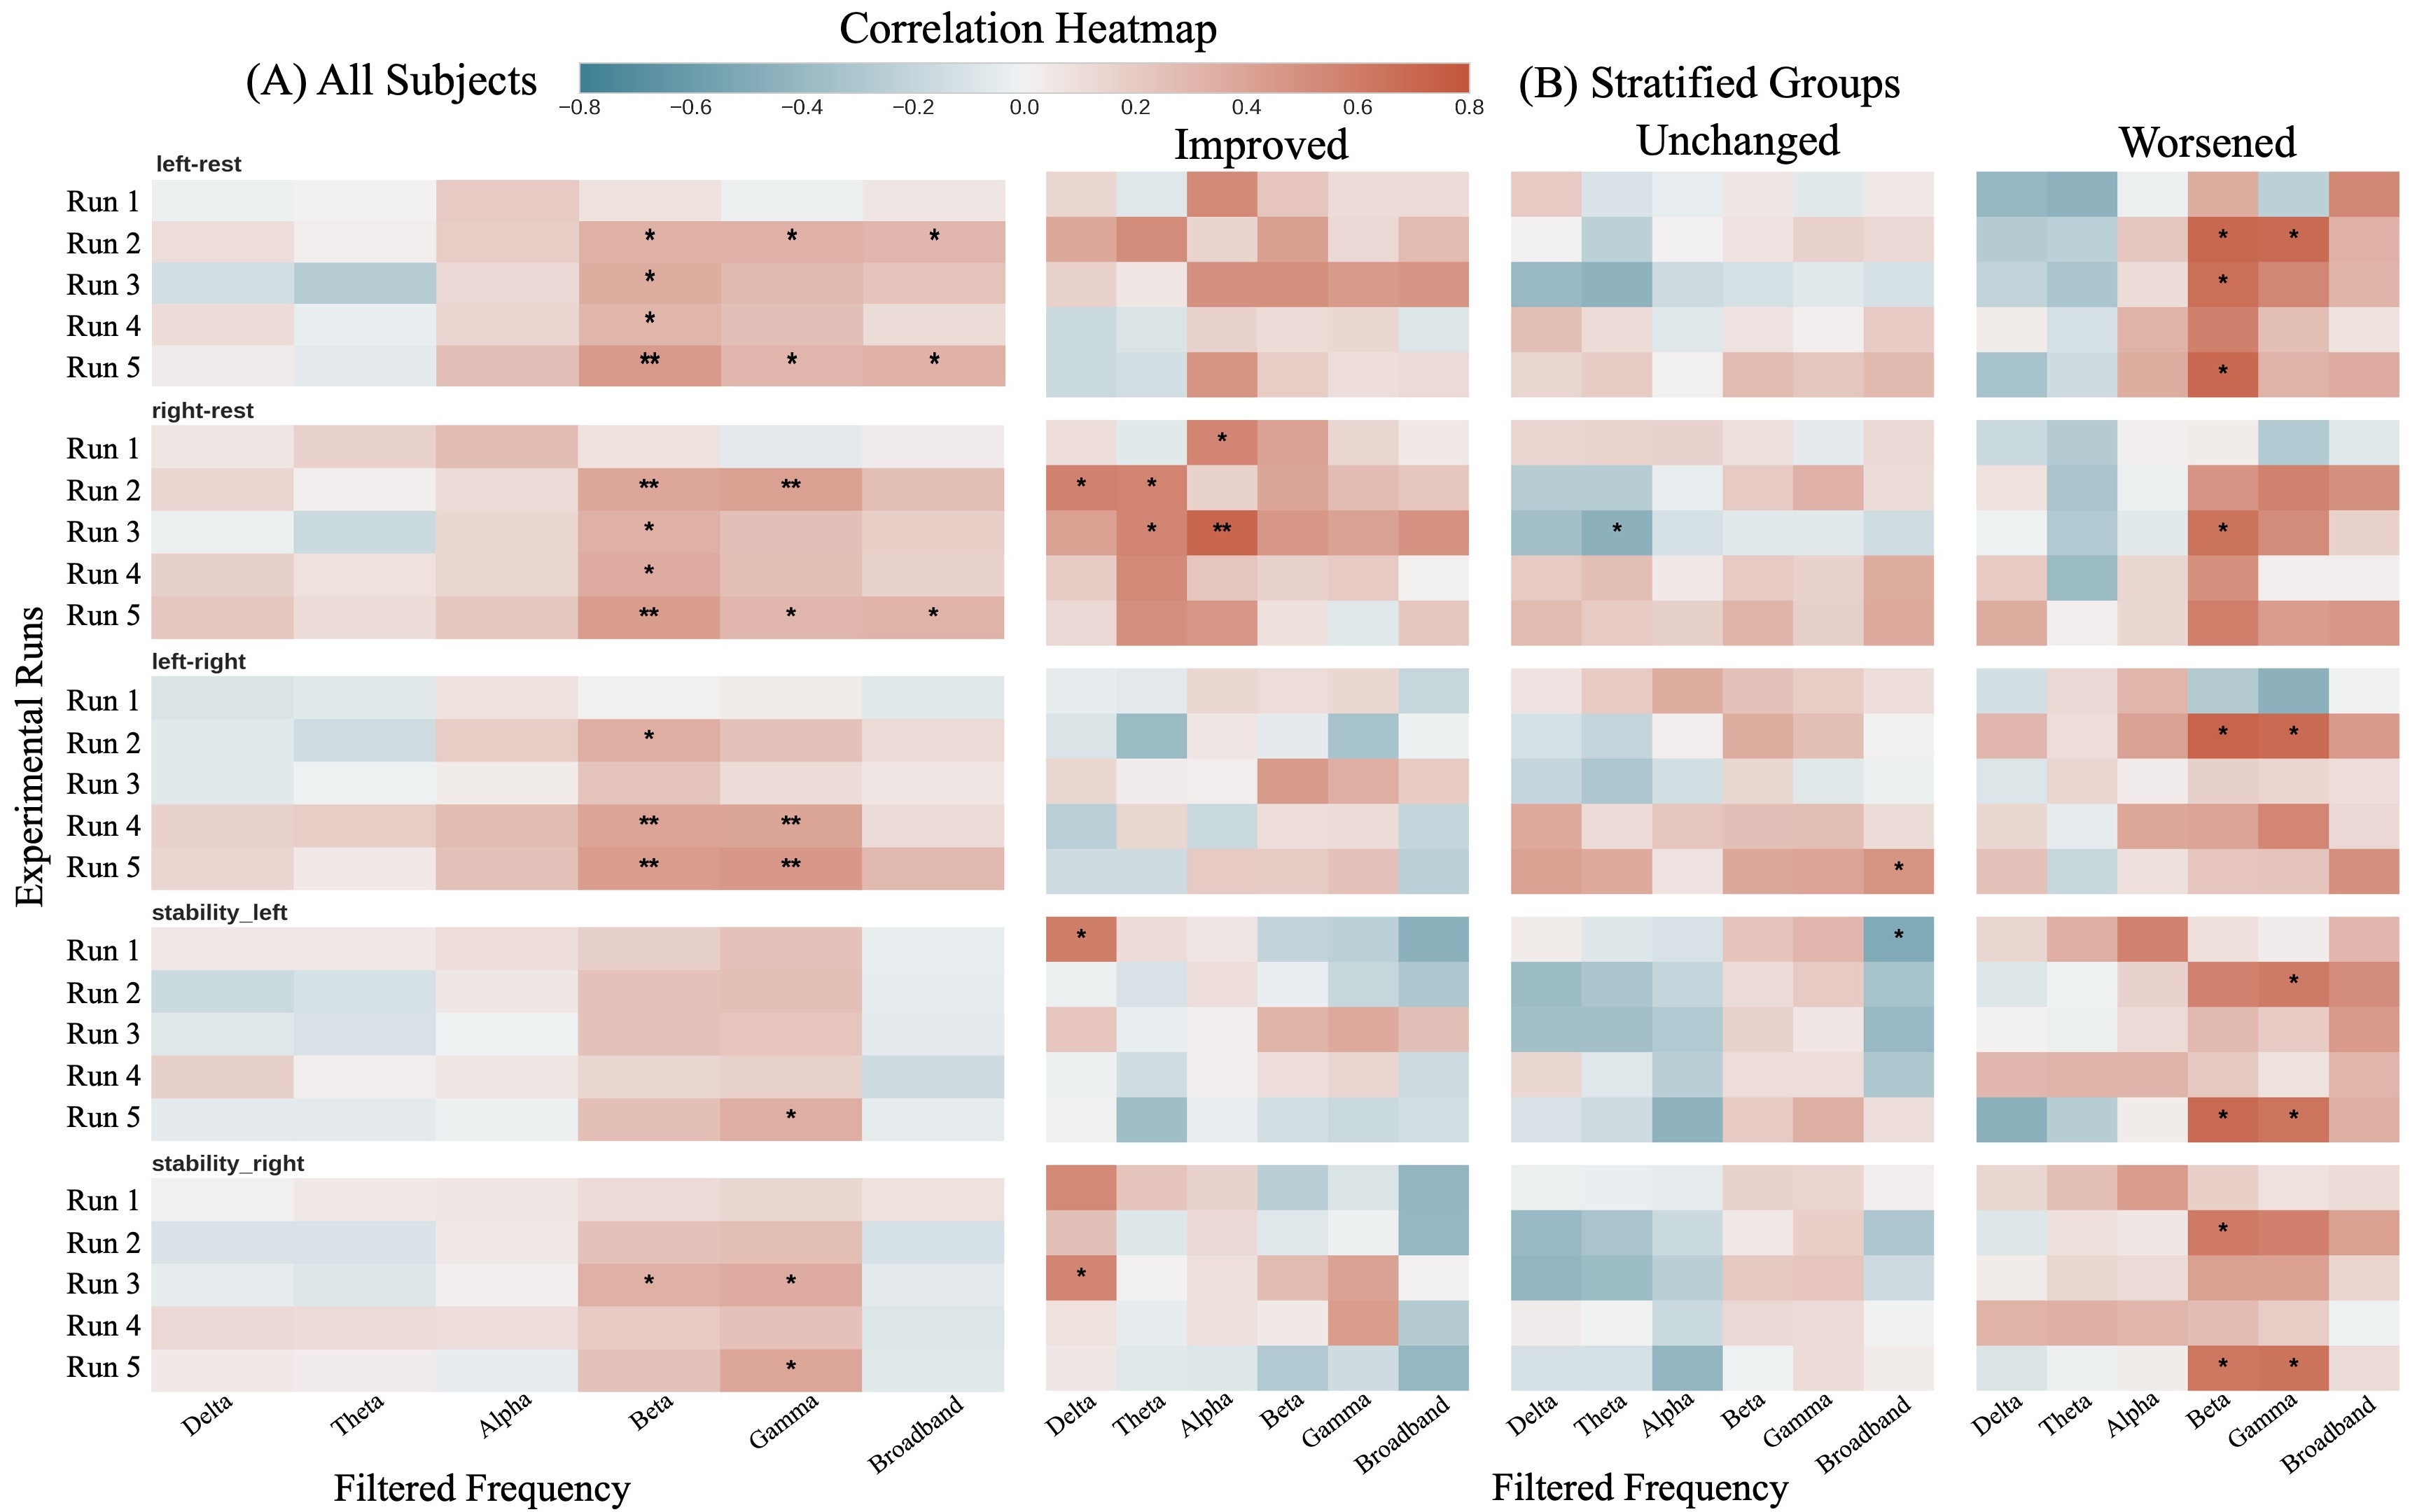
Figure 3: Spearman correlation heatmaps between expected MI-BCI performance and neural metric values across frequency bands for all subjects and behavioral groups (* $p < 0.05$, ** $p < 0.01$). [Click to inspect ↗]
4. Divergent Neural Adaptation Slopes Across Groups
To quantify longitudinal changes, slopes of neural metrics were computed across runs. Significant differences in neural adaptation slopes were observed among behavioral groups using permutation-based tests ($5{,}000$ iterations) with Holm-corrected post-hoc Mann–Whitney U tests ($p < 0.05$) (Fig. 4):
- Alpha-Band Rest Distinctiveness:
left_rest_alphaandright_rest_alphashowed positive slopes in the Improved group, but negative or near-zero slopes in the Worsened group. - Broadband Stability: Increased in the Improved group but decreased in the Unchanged group.
- Left–Right Broadband Distinctiveness & Gamma-Band Separability: Increased in the Improved group, but remained stable or decreased in the other groups.
Takeaway: Improvement in MI is associated with positive neural adaptation across multiple representational dimensions rather than a single isolated feature.
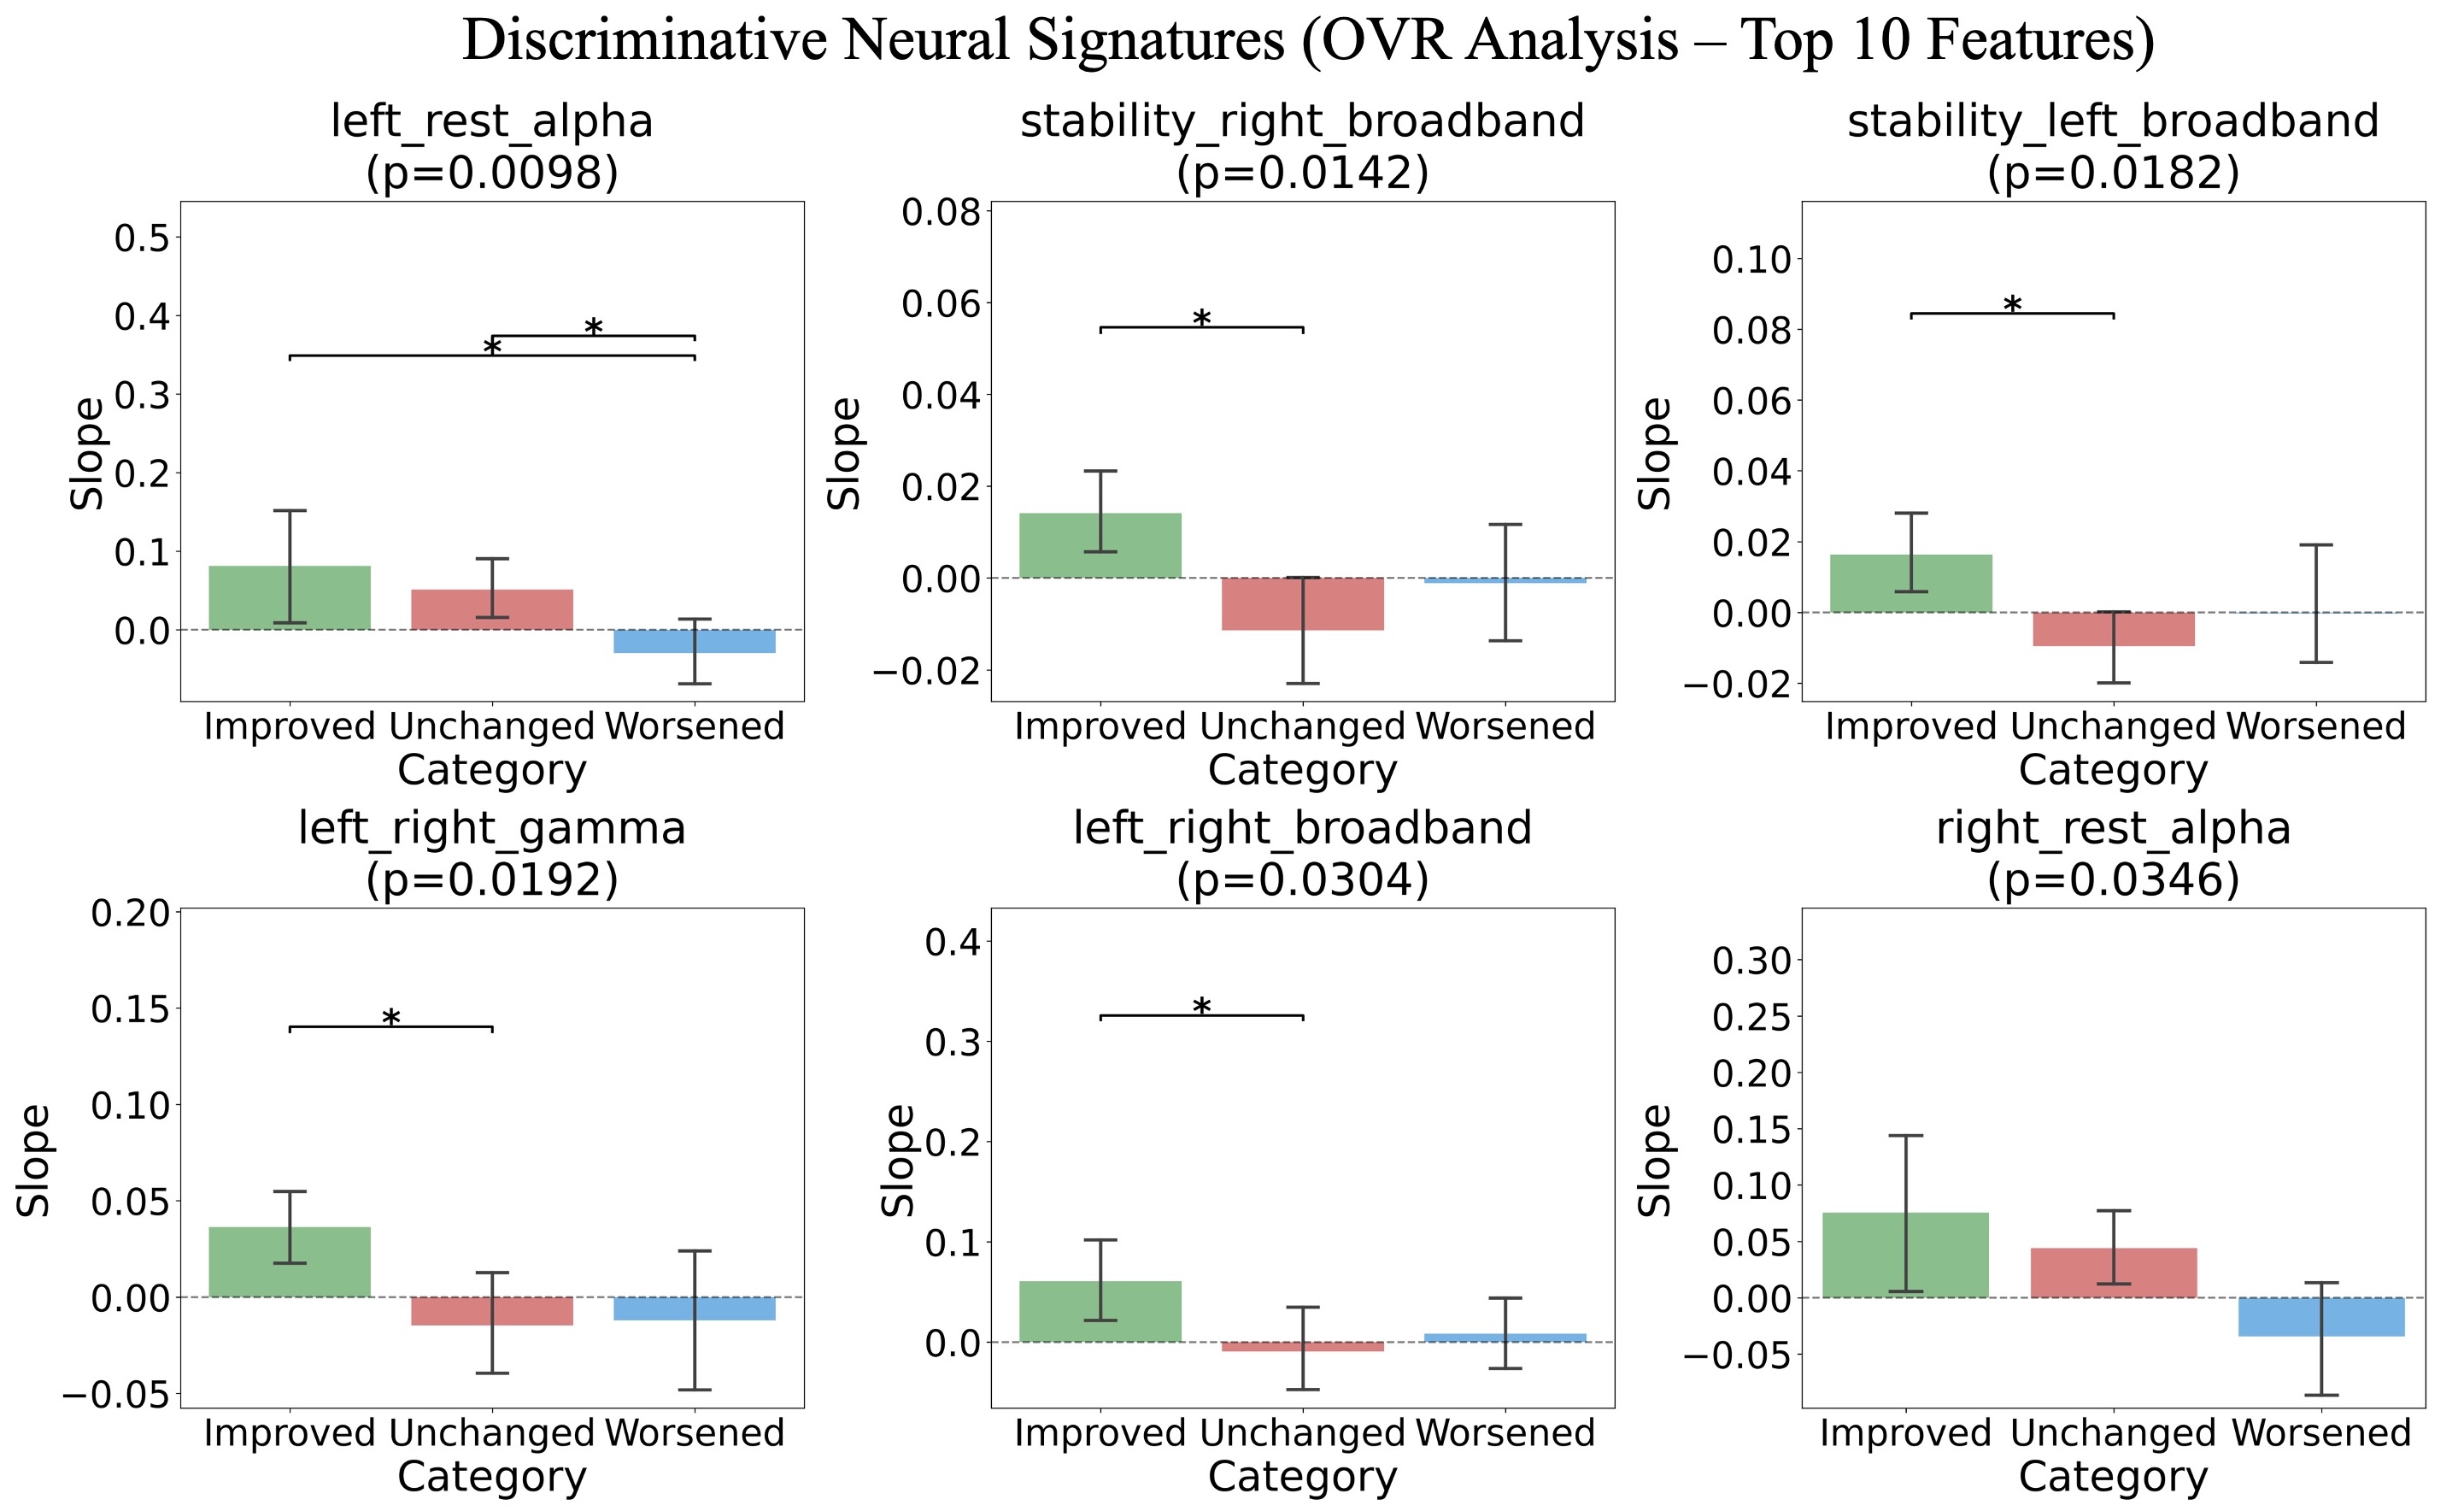
Figure 4: Divergent neural adaptation trends across behavioral groups. Subplots show mean slopes of neural metrics across training runs (permutation-based Kruskal-Wallis test with Holm-corrected Mann-Whitney U, $p < 0.05$). [Click to inspect ↗]
5. Neural Signatures of Behavioral Learning Trajectories
A One-vs-Rest (OVR) effect size analysis using on the longitudinal slopes identified the neural features distinguishing each behavioral group (Fig. 5):
- Improved Group: Showed strong positive effect sizes for broadband stability and left–right separability, indicating that increased neural consistency and class separability characterize successful learners.
- Unchanged Group: Exhibited negative effect sizes for stability and class-separability metrics, suggesting weaker neural structuring despite increased task–rest divergence.
- Worsened Group: Showed large negative effect sizes for rest-related alpha and broadband metrics, indicating that reduced separation from baseline activity characterizes declining performance.
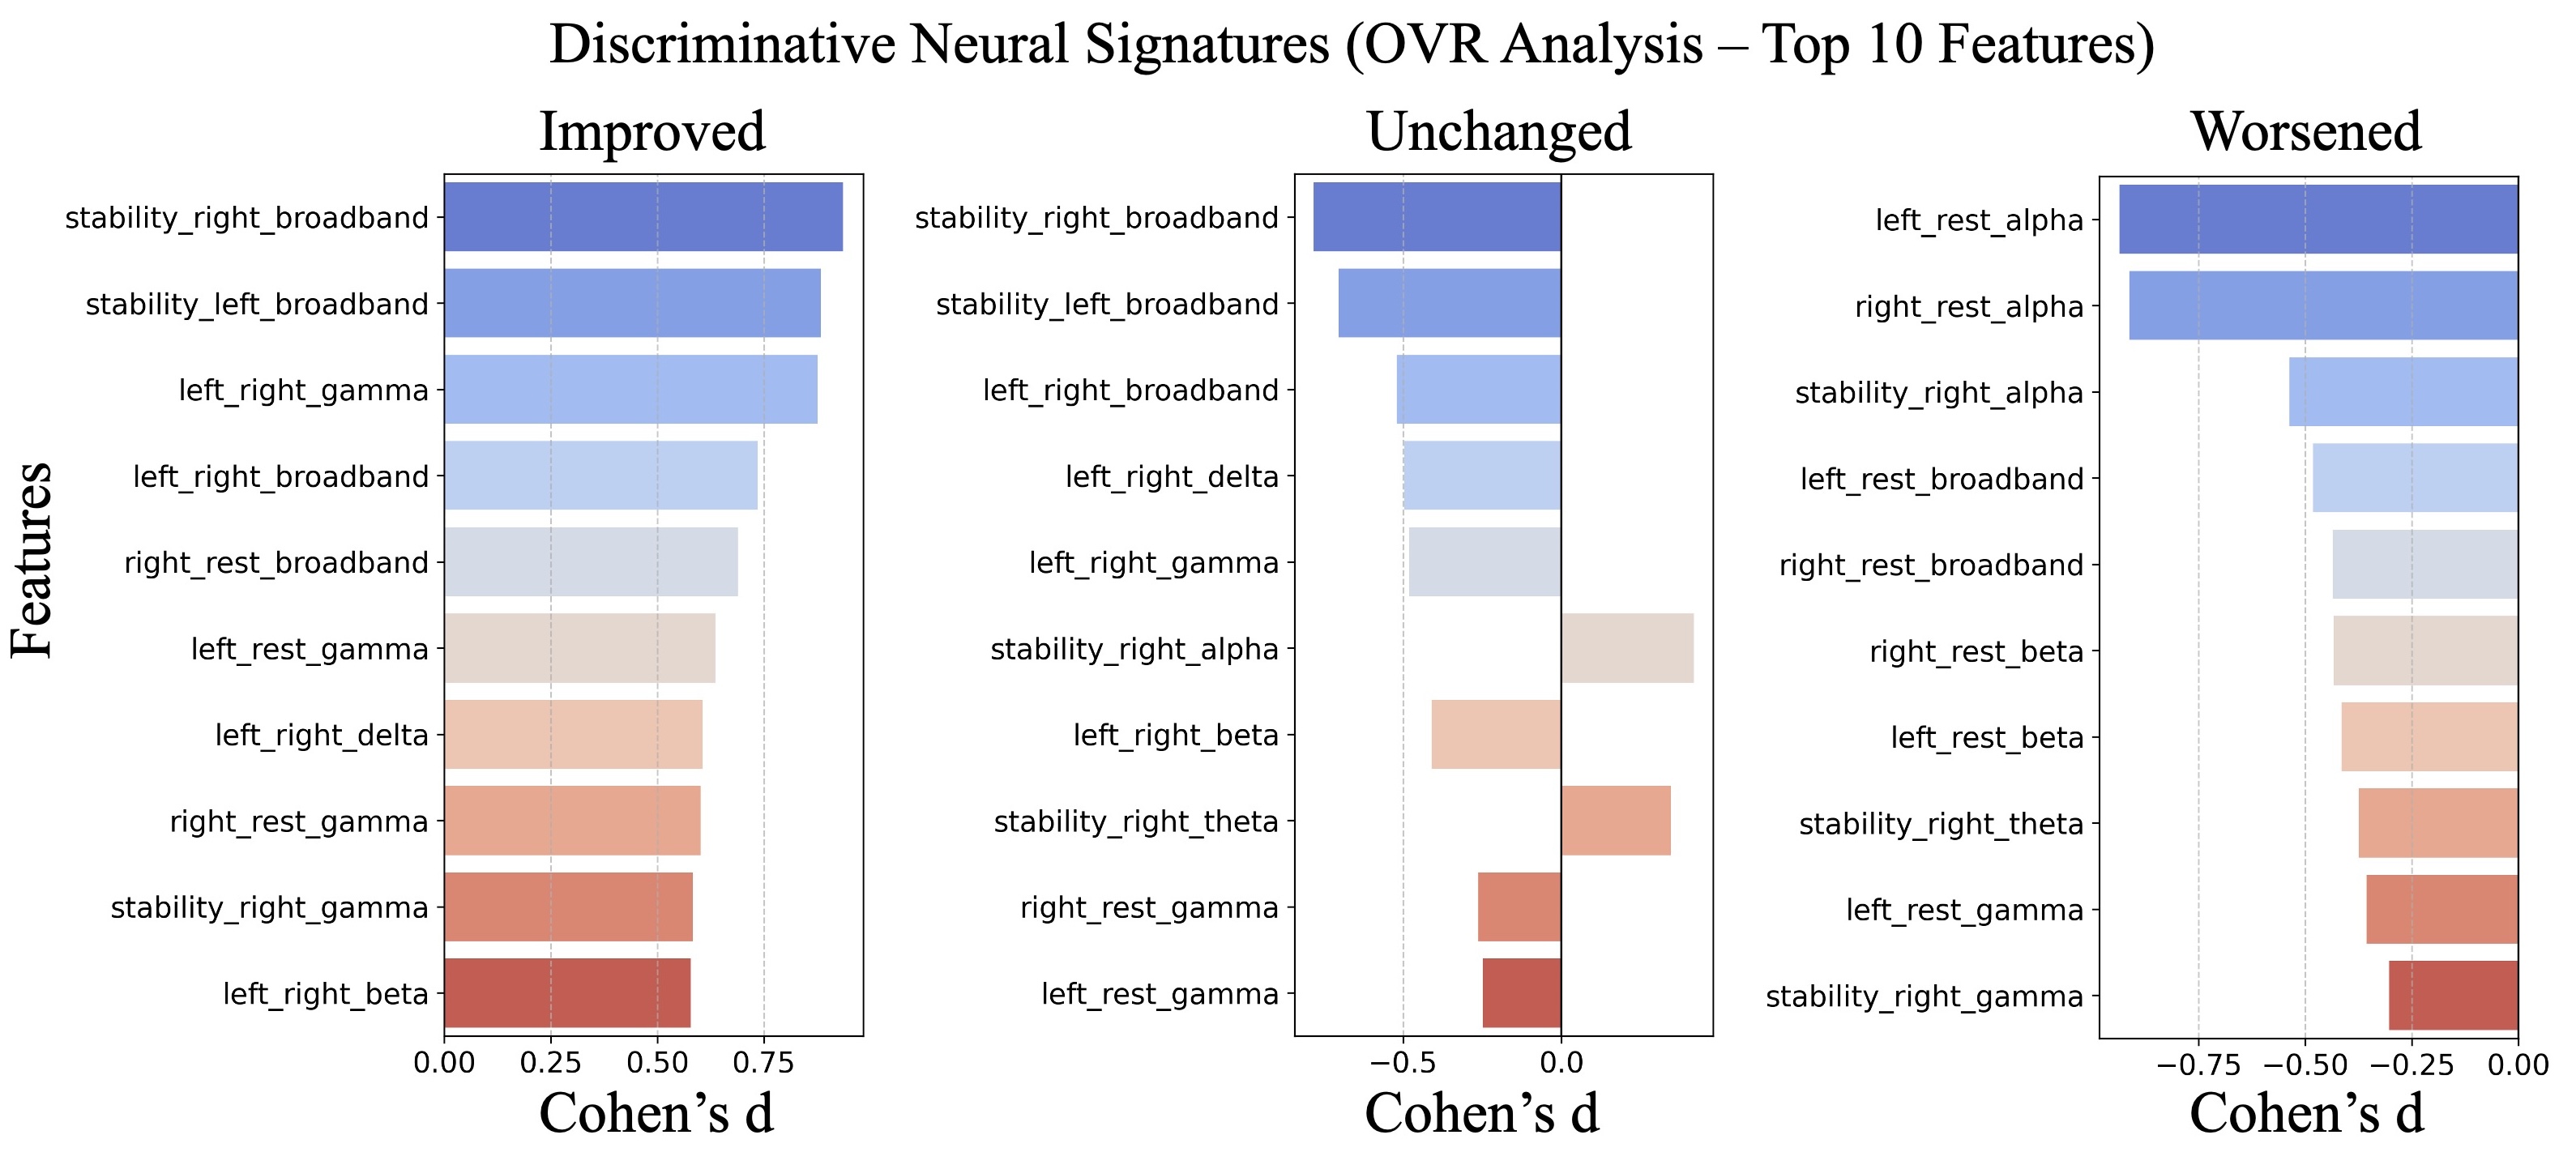
Figure 5: Discriminative neural signatures identified using One-vs-Rest (OVR) analysis. Top neural metric slopes distinguishing each behavioral group, ranked by Cohen's $d$ effect size. [Click to inspect ↗]
6. Classifier-Based Validation of Behavioral Groups
To determine whether these behavioral groups were reflected in decoding performance, a subject-specific Riemannian classifier was applied to classify left versus right motor imagery:
- Classification Accuracy Across Groups: Classification accuracy differed across groups (Fig. 6A). The Improved group achieved the highest median accuracy ($\sim81\%$), while the Worsened ($\sim69\%$) and Unchanged ($\sim63\%$) groups achieved lower accuracies.
- Correlation with Learning Slope: Classifier accuracy was positively correlated with behavioral learning slope (Pearson $r = 0.321, p = 0.034$; Fig. 6B), indicating that stronger behavioral improvement corresponded to greater neural decodability.
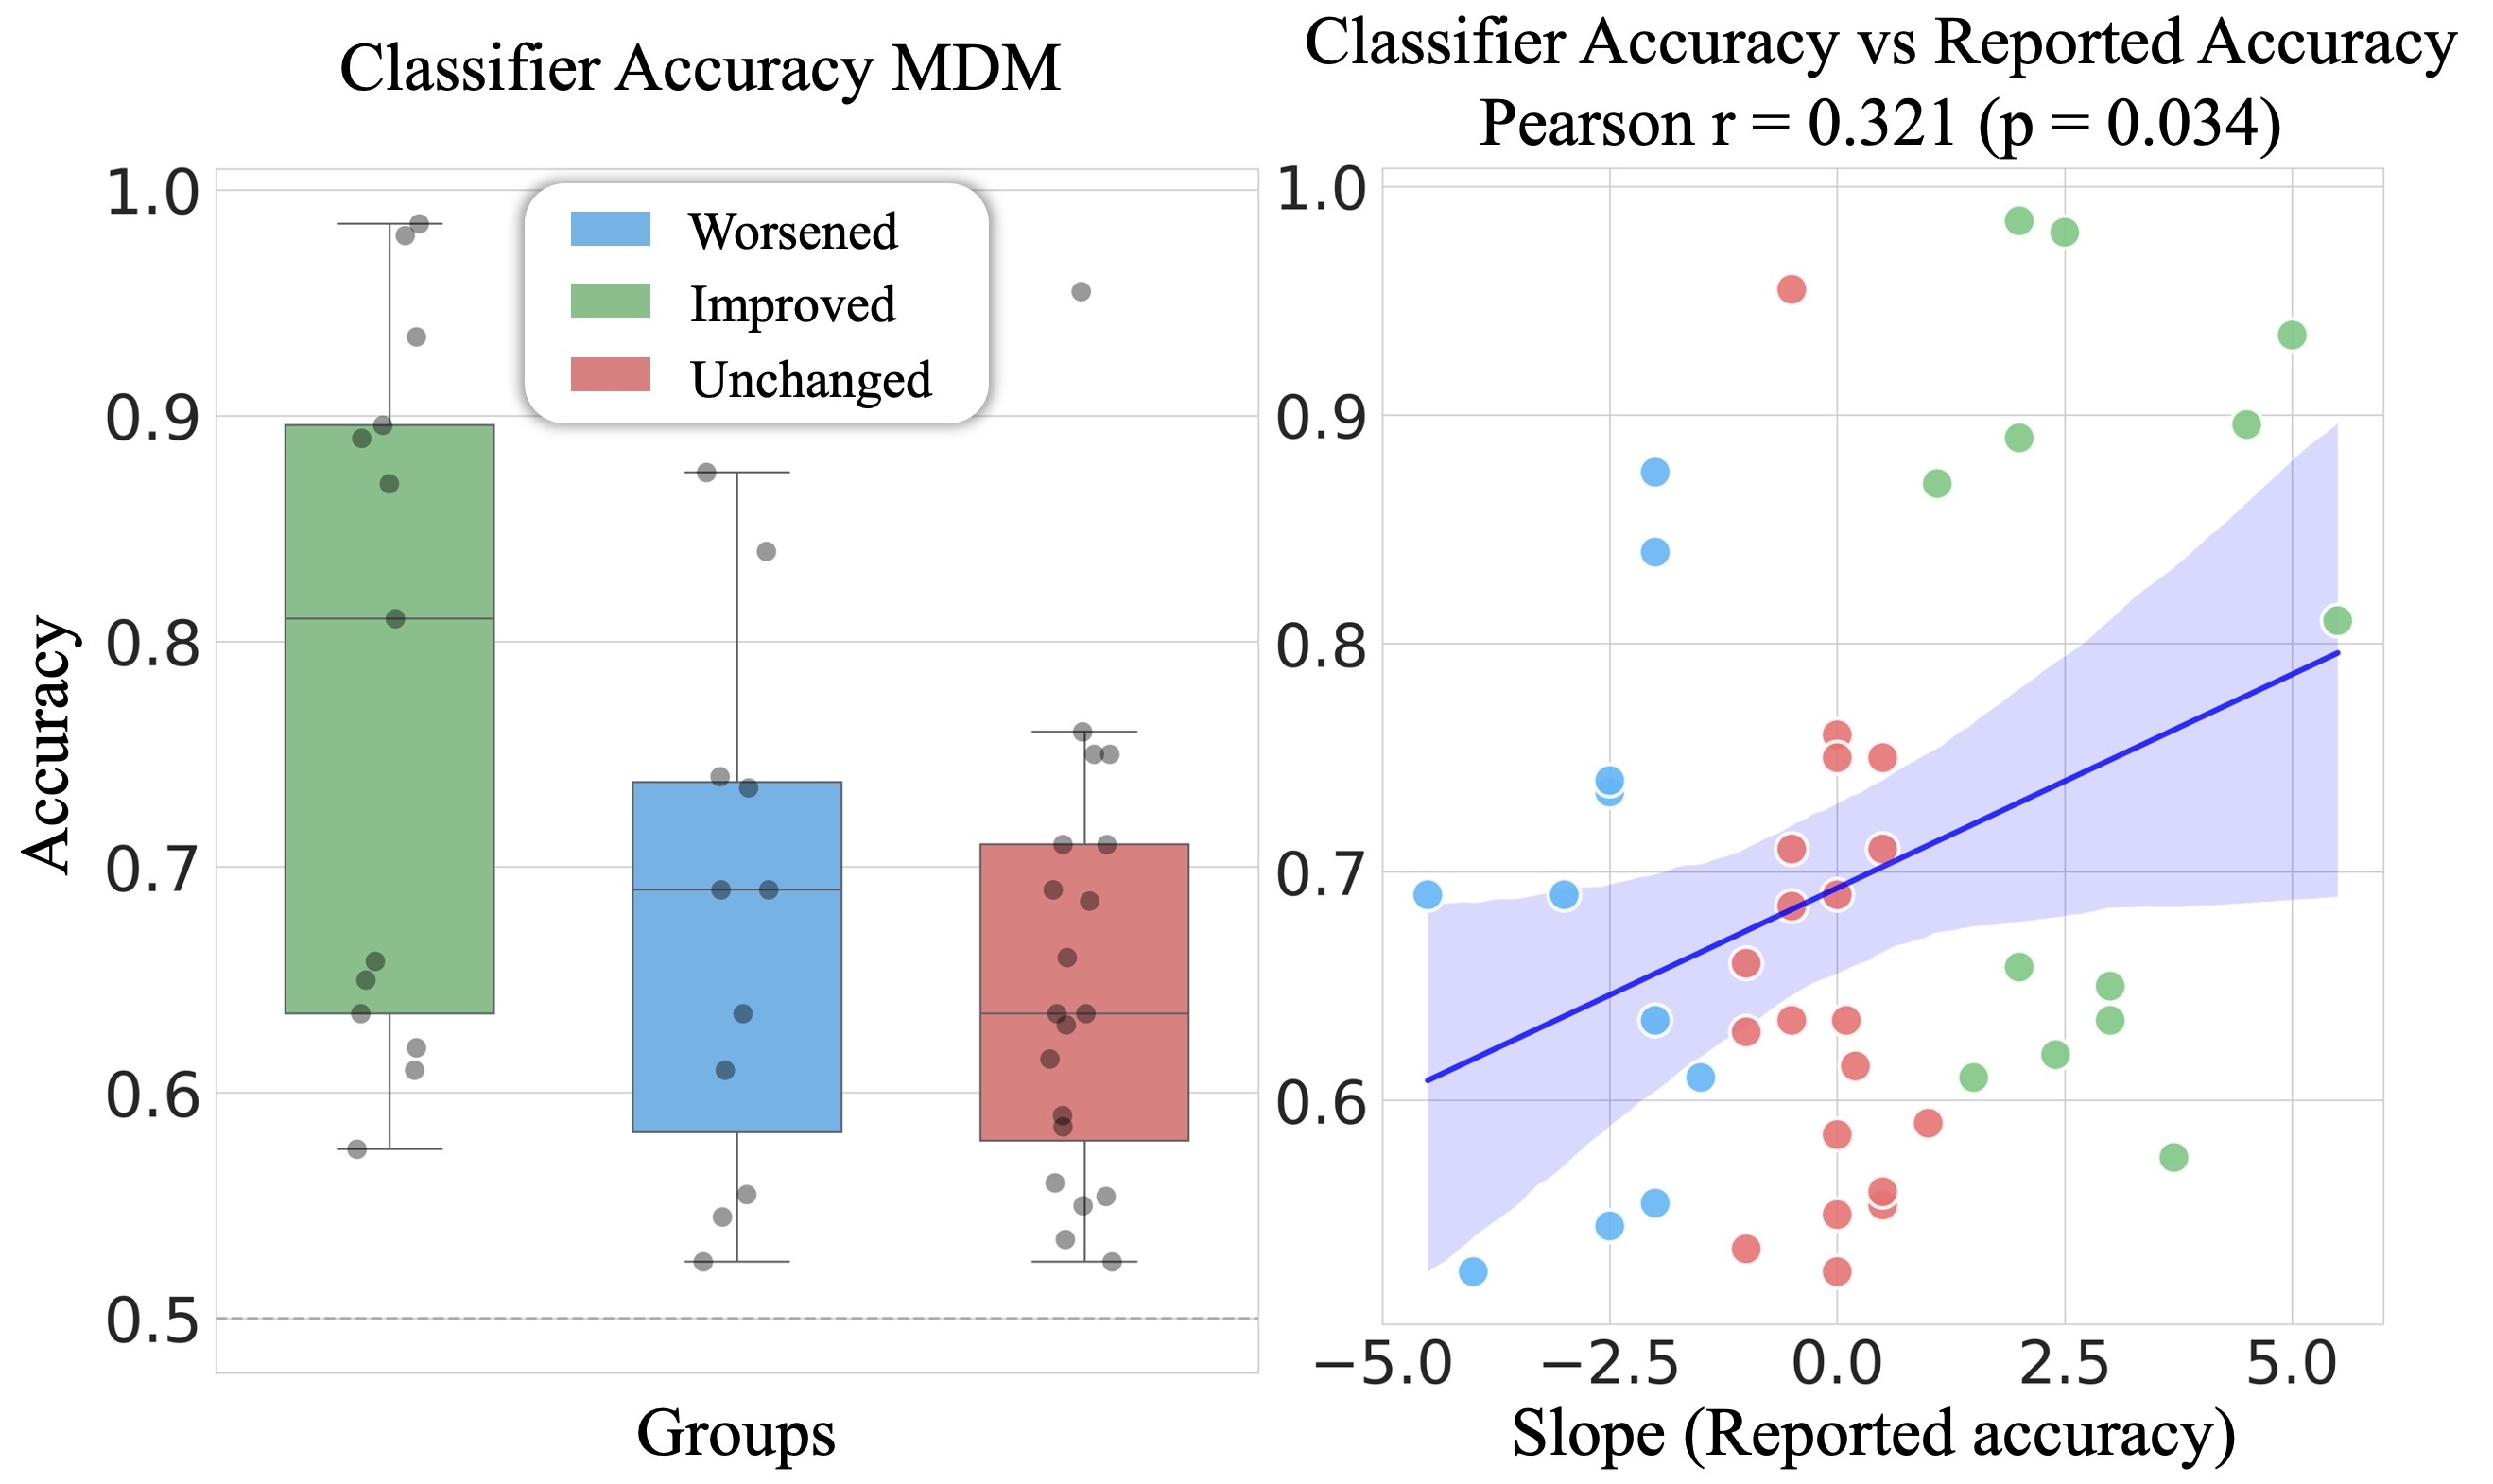
Figure 6: Relationship between classifier performance and behavioral learning trends. Left: Distribution of subject-wise MDM classification accuracy across behavioral groups. Right: Positive correlation between classification accuracy and behavioral performance slope (Pearson $r = 0.321, p = 0.034$). [Click to inspect ↗]
Poster Figure Gallery (Click to inspect high-resolution):
Fig. 1: Behavior
Fig. 2: Neural Metrics
Fig. 3: Spectral
Fig. 4: Slopes
Fig. 5: Effect Sizes
Fig. 6: MDM Decoding
Key Finding
MI-BCI learning was associated with changes across multiple dimensions of neural organization, including class stability, class distinctiveness, and rest distinctiveness. The observed patterns suggest that hemispheric separability alone may not fully explain differences in MI-BCI learning trajectories.
What Did We Find?
Our results show that MI-BCI learning is associated with changes across multiple dimensions of neural organization, including .
- Improved: Increasing trends across rest distinctiveness, class stability, and left–right distinctiveness.
- Unchanged: Declining trends in class stability and left–right distinctiveness.
- Worsened: Decreasing rest distinctiveness despite mild increases in left–right distinctiveness and stability.
Beyond Hemispheric Laterality
Both Improved and Worsened participants showed increasing left–right distinctiveness, while their behavioral trajectories differed. This suggests that hemispheric separability alone may not fully explain differences in MI-BCI learning trajectories.
Different Dimensions, Different Learning Trajectories
The OVR analysis further showed that the behavioral groups were characterized by different neural adaptation signatures across metric and frequency-band combinations:
- Improved: Strong positive effects for broadband stability and left–right separability.
- Unchanged: Negative effects for stability and class-separability metrics.
- Worsened: Large negative effects for rest-related alpha and broadband metrics.
Implications & Future Directions
These findings motivate future investigation of , where training could target not only class separability but also neural stability and separation from baseline activity.
- Individual Trajectory Tracking: Track individual neural trajectories during training.
- Metric-Specific Feedback: Investigate whether metric-specific feedback can improve MI-BCI learning.
- Cross-Paradigm Generalization: Examine whether these neural adaptation patterns generalize to other BCI paradigms and populations.
Final Takeaway
MI-BCI learning involves multiple dimensions of neural organization. Tracking class stability, class distinctiveness, and rest distinctiveness may provide a more comprehensive view of neural adaptation than hemispheric separability alone.
[1] Lotte, F., & Jeunet, C. (2018). Defining and quantifying users' mental imagery-based BCI skills: a first step. Journal of Neural Engineering, 15(4), 046030.
[2] Barachant, A., et al. (2012). Multiclass brain-computer interface classification by Riemannian geometry. IEEE TBME, 59(4), 920-928.
[3] Zich, C., et al. (2015). Real-time EEG-fMRI reveals distinct neural mechanisms of BCI performance in healthy users. NeuroImage, 114, 255-263.
[4] Cho, H., et al. (2017). EEG dataset for motor imagery brain-computer interface. GigaScience, 6(7), gix034.